

Last reviewed: 22 October 2026. Journal Citation Reports are updated every June, so check the latest release before quoting any value.
A supervisor says to target a “high-impact journal.” One journal shows a CiteScore of 8.4. Another has a Journal Impact Factor of 5.2. A Google Scholar profile shows an h-index of 12. Which number deserves attention?
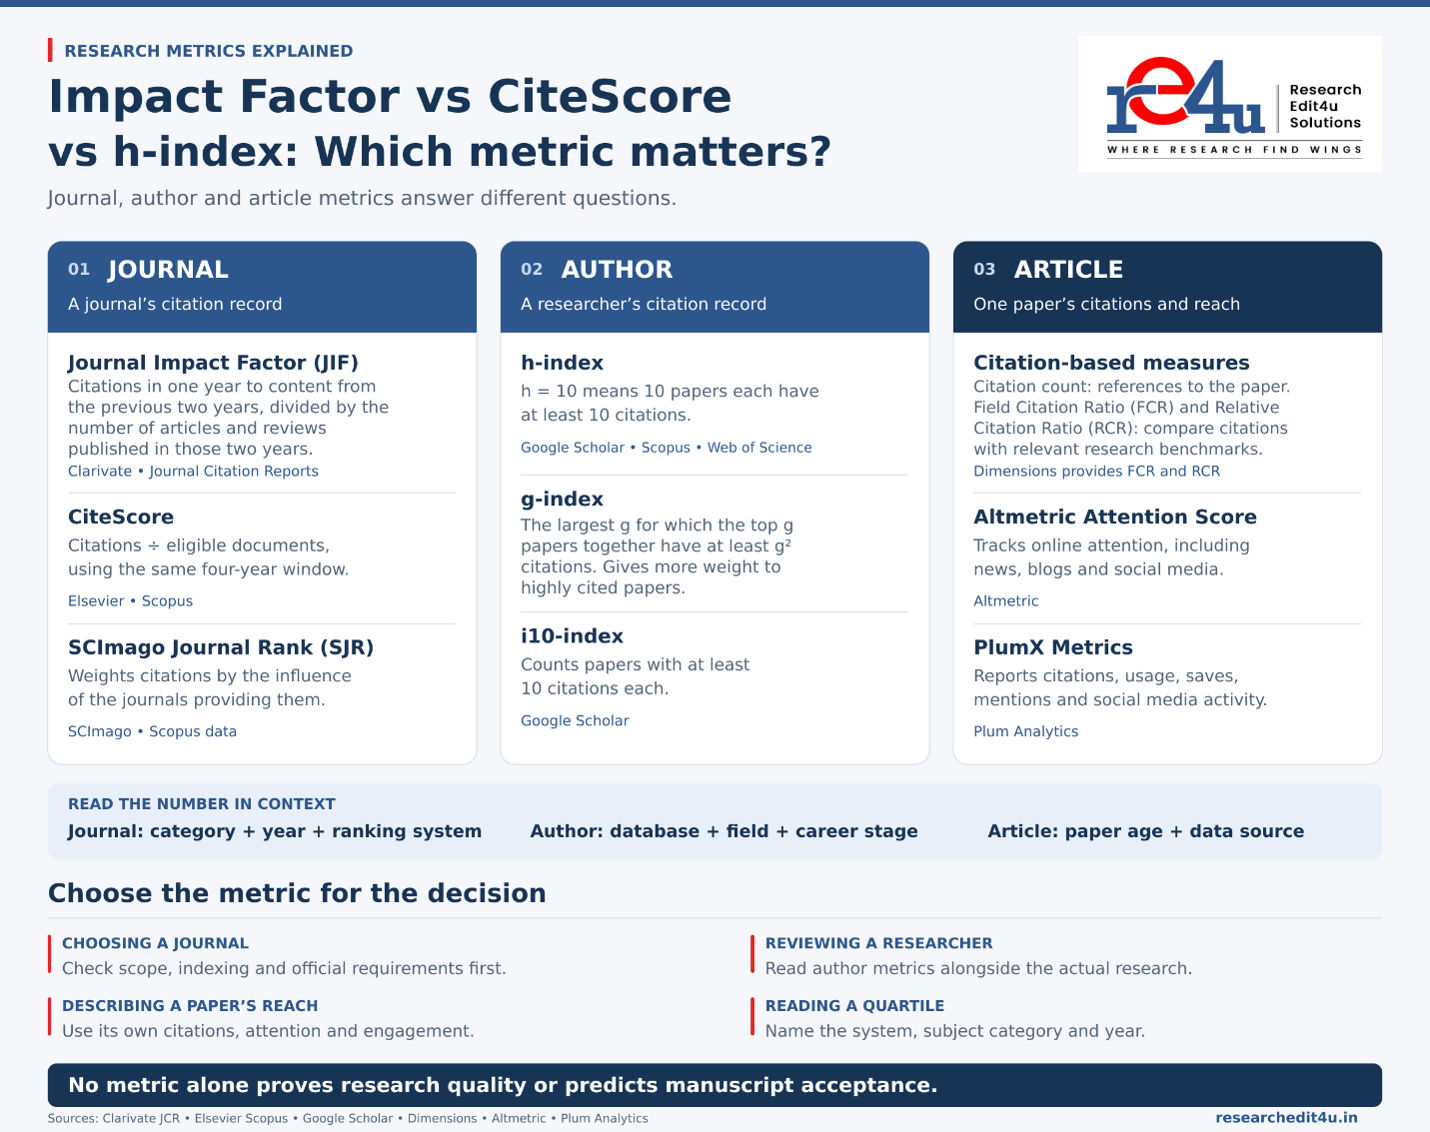
The three sit at different levels of measurement. Journal Impact Factor and CiteScore describe a journal. The h-index describes an author’s publication record. A third family of indicators describes a single article. None of them reveals whether a particular manuscript suits a particular journal.
Journal metrics, author metrics and article metrics at a glance
What is measured? | Common measures | Where to find them | What they tell you | What they cannot tell you |
Journal | Journal Impact Factor (JIF) | Clarivate’s Journal Citation Reports | How often recent papers in a journal are cited, on average. | Whether a particular paper in that journal is good quality. |
Journal | CiteScore; SCImago Journal Rank (SJR) | CiteScore: Scopus; SJR: SCImago and Scopus | How often a journal’s papers are cited. SJR also considers which journals provide those citations. | Whether a journal is better than another simply because its score is higher on a different measure. |
Author | h-index; i10-index | h-index: Google Scholar, Scopus and Web of Science; i10-index: Google Scholar | How widely a researcher’s publications have been cited. | Whether all their research is high quality or whether they are a better researcher than someone else. |
Individual paper | Citation count; Field Citation Ratio (FCR) | Dimensions and other citation databases; FCR specifically in Dimensions | How often a paper is cited. FCR compares its citations with similarly aged papers in the same field. | Whether its methods and findings are reliable. |
Individual paper | Altmetric Attention Score; PlumX Metrics | Altmetric; Plum Analytics | Altmetric tracks online attention. PlumX reports citations, views, saves and other forms of engagement. | Whether the attention is positive or the research is correct. |
Most of these indicators are produced by private organisations, each with its own calculation method, so a number only means something when its source is known (Mondal and Mondal, 2022).
What does Journal Impact Factor measure?
The Journal Impact Factor is reported in Clarivate’s Journal Citation Reports (JCR). It divides the citations received in a JCR year by items the journal published in the previous two years, by the number of citable items (articles and reviews) from those same two years.
Clarivate’s JCR Reference Guide adds an important detail. The numerator counts citations to any item type, including editorials and letters, while the denominator counts only articles and reviews. For that reason the JIF is not a mathematical average of citations per paper.
A JIF of 5 therefore does not mean that:
• every article in the journal receives five citations;
• a newly published paper will be cited five times;
• a journal with a JIF of 6 is twice as good as one with a JIF of 3;
• a manuscript has any particular chance of acceptance.
Citation habits also differ sharply between fields. Clarivate notes that JIF values vary by discipline and are most useful when read through category percentile or quartile data. A JIF of 4 can be strong in one category and ordinary in another.
JIF becomes the relevant number when a university, funder or promotion policy names Journal Citation Reports or Web of Science rankings.
EXAMPLE
Consider Scientific Reports, a real journal published by Nature Portfolio. Its website currently lists a 2025 Journal Impact Factor of 4.9, reported in 2026. Scientific Reports
To understand that number, follow the calculation below. The counts are hypothetical teaching examples, not the journal’s actual figures.
Step | Simple explanation | Illustrative number |
1. Count articles and reviews | Count the research articles and reviews published during 2023 and 2024. | 100 |
2. Count citations | Count citations received during 2025 to the journal’s content published in 2023 and 2024. This can include citations to editorials and letters. | 490 |
3. Divide | Divide the citation total by the number of articles and reviews. | 490 ÷ 100 = 4.9 |
The years matter: the 2025 JIF uses citations made in 2025 to content from the previous two years. It is released the following year.
Now imagine you publish your first paper in this journal in 2026. Its JIF of 4.9 does not promise that your paper will receive approximately five citations. Your paper might receive none, five or many more. The JIF describes the journal’s citation record; it does not predict your paper’s performance or prove its quality.
What do CiteScore and SJR measure?
CiteScore is calculated from Scopus data. It uses a four-year window: citations received over four years to five document types (articles, reviews, conference papers, book chapters and data papers), divided by the number of those same document types published in the same four years. Elsevier explains its use in Scopus on its support pages.
SCImago Journal Rank (SJR) is a separate journal indicator built by the SCImago research group, also from Scopus data. Journal websites often display an SJR widget showing the journal’s quartile, its SJR value and a trend line. Because SJR rewards citations from influential sources, it should be read as a ranking signal and not as a direct statement of quality.
Scopus reports ranks and percentiles inside subject categories, and these give a raw CiteScore its context.
CiteScore example
The Journal of Spine Surgery reports a 2025 CiteScore of 2.6. This uses citations received during 2022–2025 to eligible documents published during those same four years. Journal of Spine Surgery
Here is a simplified calculation. These counts are illustrative, not the journal’s actual totals.
What is counted? | Example |
Eligible documents published during 2022–2025 | 1,000 |
Citations received during 2022–2025 to those documents | 2,600 |
CiteScore: citations ÷ documents | 2,600 ÷ 1,000 = 2.6 |
This means 2.6 citations per eligible document, on average, within that calculation window. Some documents may receive many citations, while others receive none. It does not mean every paper receives 2.6 citations.
SJR example
Scientific Reports currently lists a 2025 SJR of 0.893. This is a weighted score, so it does not mean 0.893 citations per paper. Scientific Reports
To understand the weighting, imagine two journals:
Hypothetical journal | Citations received | Where the citations come from |
Journal A | 100 | Mainly journals with higher SJR scores |
Journal B | 100 | Mainly journals with lower SJR scores |
Even with the same citation count, their SJR scores can differ because a citation from a journal with a higher SJR carries more weight. The final calculation also considers other factors. Scopus Support Center
For context, a 90th CiteScore percentile means a journal stands approximately in the top 10% of its subject category. It does not mean its papers are 90% correct or that it accepts 90% of submissions.
Why the three headline numbers cannot be compared?
A CiteScore of 8 and a JIF of 5 are not marks out of 10. They draw on different databases, count different document types and use different time windows. A journal with a high CiteScore and a lower JIF is not contradicting itself.
Comparing a CiteScore with a JIF, or either with an h-index, resembles asking whether 30°C is greater than 15 kilometres. Each number is real, and the comparison is meaningless.
The working rule is simple: when an official requirement names a database or a metric, follow it. If a regulation asks for a JCR journal, a higher CiteScore does not replace that condition. If it asks for Scopus indexing or a Scopus quartile, the JIF is not the deciding figure.
Where do Q1, Q2, Q3 and Q4 fit?
Quartiles are the usual way to make a raw metric comparable across fields. They rank a journal inside its own subject category and split the ranked list into four equal groups.
• JCR quartiles come from a journal’s JIF rank within a Web of Science category. Q1 marks the top 25% of journals in that category.
• Scopus quartiles come from rank within a Scopus subject category, using CiteScore (and, on SCImago, SJR).
“This is a Q1 journal” is therefore an incomplete statement. A complete one names the system, the subject category and the year. A journal listed in several categories can hold different quartiles in each.
This article deliberately stops at that overview. The step-by-step explanation, including how to look a journal’s quartile up, sits in a dedicated guide: What Are Q1, Q2, Q3 and Q4 Journals? A Simple Guide.
What do author-level metrics measure?
Author-level metrics summarise a researcher’s output and citations. Three are common.
• h-index. Proposed by Jorge Hirsch in 2005. An author has an h-index of 10 when 10 of their papers have each received at least 10 citations.
• g-index. Introduced by Leo Egghe in 2006. It is the largest number g for which the top g papers together have at least g² citations. It gives more weight to a few highly cited papers than the h-index does.
• i10-index. Used in Google Scholar profiles. It counts the papers with at least 10 citations.
The h-index also depends on where it is read. In one published example, the same author’s h-index was 8 in Google Scholar and 4 in Scopus, because the databases index different journals (Mondal and Mondal, 2022). Google Scholar usually shows the highest value because it covers the most sources, and it can include erroneous entries, so a profile deserves a periodic check.
DORA’s h-index resource adds two further limits. Values differ by discipline, and they rise with career length, which disadvantages early-career researchers. A quoted h-index should always name the database, the field and the career stage.
The h-index can also be calculated for a journal. Google Scholar’s h5-index applies the same logic to articles from the last five completed years, although it is published only for the top journals in each category.
What do article-level metrics measure?
Article-level metrics describe one paper, and they fall into three families.
Citation-based. The simplest indicator is the paper’s own citation count. Dimensions adds two relative measures:
• The Field Citation Ratio (FCR) compares an article with similarly aged articles in its field. A value above 1 means above-average citations. Articles younger than two years show no FCR.
• The Relative Citation Ratio (RCR) compares an article with other articles in its research area. A value above 1 again means an above-average citation rate.
Attention-based. The Altmetric Attention Score summarises mentions in news outlets, social media, Wikipedia and blogs, with each source weighted differently. It shows how much attention a paper received. It does not show whether that attention was favourable or whether the research is sound.
Mixed. PlumX reports raw counts in five categories: citations, usage (views and downloads), captures (bookmarks and saves), mentions and social media activity.
Because citations take time to accumulate, article-level figures for a recent paper are always thin. These indicators suit a publication list or a funding report better than a quality verdict.
Does a strong metric mean a manuscript belongs in that journal?
No. A journal can hold an excellent citation profile and still be the wrong destination, and an acceptance decision turns on editorial fit, contribution and methodological quality. A highly ranked oncology journal has no use for a paper outside its scope.
Before shortlisting a journal, check:
• aims and scope;
• recently published articles in the same area;
• accepted article types and typical methods;
• the readership the journal serves;
• institutional or funder requirements.
Metrics then help narrow a shortlist that fit has already produced.
How can a journal’s metrics be verified?
A number shown on a journal homepage is a claim, not evidence.
The Journal Impact Factor is a proprietary Clarivate product. Other providers use the same words with a prefix, and several such labels circulate among questionable journals: SJIF (Scientific Journal Impact Factor), UIF (Universal Impact Factor), GIF (Global Impact Factor) and RJIF (Research Journal Impact Factor). Their values are often strikingly high and carry no weight in academic assessment (Mondal and Mondal, 2022).
Indexing badges can mislead as well. Hijacked journals, whose websites are cloned or taken over, display metrics as false proof of indexing. A genuine SJR badge can also stay on a site after the journal has stopped being indexed.
Four questions settle most cases:
1. Who calculated it? Only Clarivate issues the Journal Impact Factor.
2. Which database sits behind it? Web of Science, Scopus, Google Scholar or an unknown provider.
3. Which year does it refer to? Old values keep circulating on websites and in promotional emails.
4. Can it be confirmed independently? Look the title up in Journal Citation Reports or the Web of Science Master Journal List for a JIF, and in Scopus Sources for CiteScore and SJR.
If the journal itself is the only place an impressive metric appears, treat that as a warning sign. The full verification routine is in How to Spot a Predatory Journal Before You Submit: 2026 Verification Checklist.
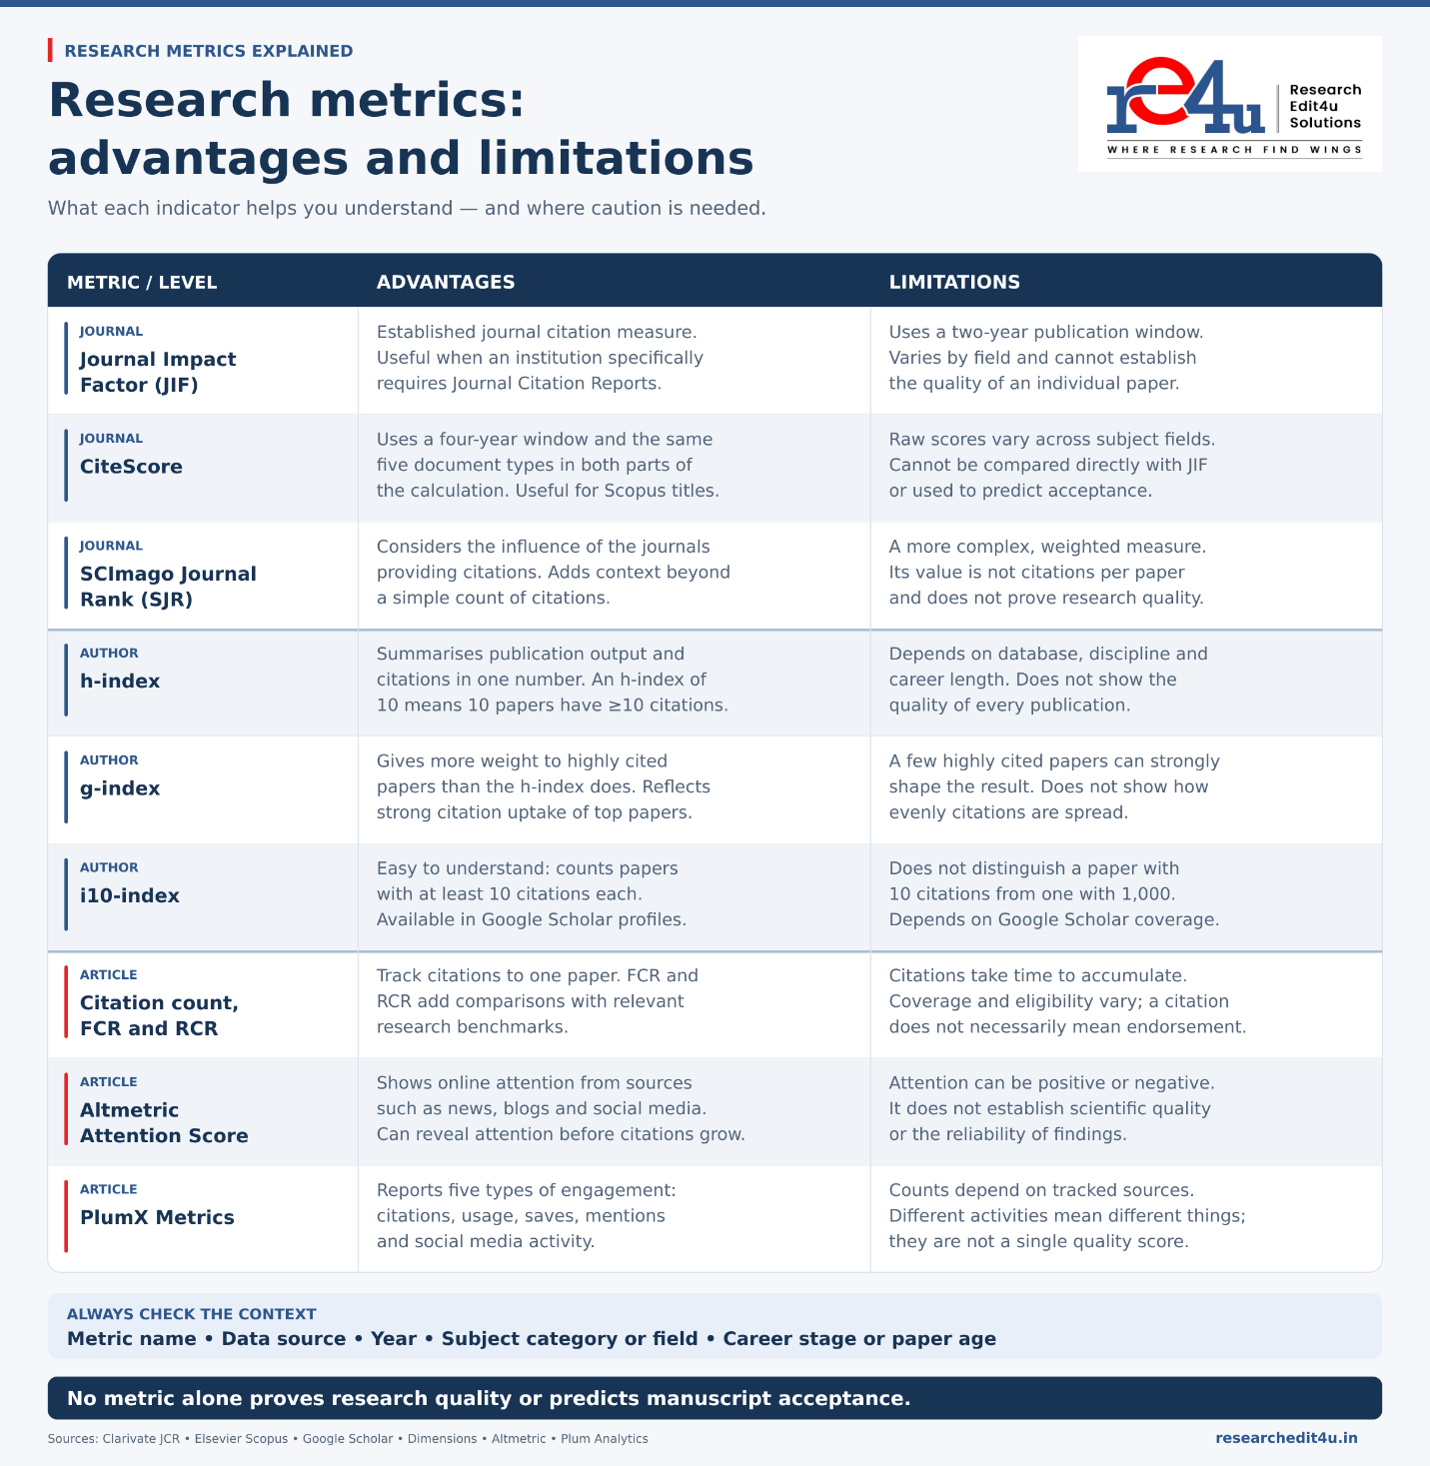
Which metric suits which decision?
Decision | Metric that may help | First check |
Choosing a journal | JIF, CiteScore, SJR and the quartile in the relevant category | Official requirements, scope and verified indexing |
Reviewing a research profile | h-index, g-index, i10-index | Database, field and career stage |
Describing one paper’s reach | Citation count, FCR or RCR, Altmetric, PlumX | Paper age and the source of the data |
Judging a paper’s quality | None of the above | The research itself |
“Metrics are signals. Reading the paper remains the verdict.”
Frequently asked questions
Is CiteScore better than Journal Impact Factor?
Neither is better in general. They come from different databases, use different windows and count different document types. The relevant one depends on the journal’s indexing and on any institutional requirement.
Can a journal have a CiteScore but no Journal Impact Factor?
Yes. Scopus coverage and Web of Science coverage are independent, so a journal can appear in one and not the other.
Is a Q1 journal the same as a high-impact-factor journal?
Not exactly. A quartile describes relative position inside a subject category and ranking system. A raw impact factor shows the quartile only when compared with other journals in its category.
Why is the Google Scholar h-index higher than the Scopus h-index?
Google Scholar indexes a wider range of sources, so it counts more publications and citations. Scopus and Web of Science cover narrower sets.
Does publishing in a high-impact journal raise the h-index?
Only if the paper collects enough citations to change the count. The journal’s reputation does not add to the h-index by itself.
Can impact factor predict whether a paper will be accepted?
No. It describes a journal’s past citations. Acceptance depends on fit, contribution, methodology, reporting quality and peer review.
What is the difference between journal-level and article-level metrics?
Journal-level metrics summarise all content in a journal, while article-level metrics track one paper through its own citations and attention.
Need help choosing a journal for a manuscript?
Choosing a journal takes more than sorting a list by impact factor. ResearchEdit4u’s journal selection and pre-submission support helps researchers assess journal fit, indexing, publication requirements and manuscript readiness before submission.